
HOW IT WORKS
What is a photographic aerial survey?
Instead of relying on observers to spot animals from a moving aircraft, we mount survey-grade cameras in a specially designed pod on the wing strut of an aircraft. Flying systematic transects at about 300 m above ground, the cameras photograph the survey area at an oblique angle.
Trained analysts then identify and count wildlife in the images. Because each count is tied to a photograph, results can be checked, audited and re-analysed at any time.

The camera pod in flight, south-eastern Zimbabwe, 2026
HOW THE PHOTOGRAPHS ARE TAKEN
An angled view, flown line by line

Simplified illustration, not to scale.
SIDE BY SIDE
Observer counts and photographic surveys compared
TRADITIONAL OBSERVER COUNT
How animals are counted
Can results be checked?
Repeatability
Flying height
Extra value
Observers have seconds to count
from the aircraft
No record beyond the observer's notes
Varies with observer skill and fatigue
About 90 m above ground
Count only
PHOTOGRAPHIC SURVEY
Counted from high-resolution images
after the flight
Every detection is tied to an image
and permanently archived
Same method every survey, and the
images can be re-checked
About 300 m above ground: less
disturbance and risk
A richer dataset that supports deeper
analysis, now or years later
THE PROCESS
Five steps from flight plan to decision
From survey design to results usually takes two to three months, depending on the size of the property, your budget and your objectives.

Step 01
Survey design
We agree your goals, priority species and area, then plan flight lines and image coverage.

Step 02
Data capture
Survey-grade cameras fly systematic lines, timed for the best light and visibility. Each image is tagged with the aircraft's position, height and angle.

Step 03
Data processing
We check flight performance and map the ground covered by every image. Overlapping images are matched so no animal is counted twice.

Step 04
Analysis
Our trained annotators find and label every animal on our own platform, supported by detection algorithms where suitable (some surveys are full manual counts). Ecologists then verify the annotations, and population and distribution estimates are calculated.

Step 05
Review and reporting
You receive a clear report and maps, and we walk you through what the results mean for your property.
People and algorithms, working together
PEOPLE
A trained annotation team
People find and label the animals, including full manual counts. We can train your team too.
ALGORITHMS
Proprietary and open-source
Detection models speed up the search where they suit the survey, never replacing human review.
QUALITY CONTROL
Verified by ecologists
Every annotation is checked by ecologists before a number reaches your report.
PLATFORM
Our own annotation platform
Built for aerial wildlife imagery, so every detection is reviewed, labelled and stored in one place.
WHAT OUR TEAM SEES
Animals detected, labelled and verified

WHAT YOU RECEIVE
Data you can act on, and defend
Minimum counts per species, plus statistical estimates of total numbers and density
Distribution and density maps for each species
A full report: method, flight performance, results and management recommendations
Secure storage of your data with us, alongside the computing power and expertise to get the most out of it
SAMPLE REPORT · ON REQUEST
See a real report before you commit
An anonymised survey of a 46,400 ha private reserve: method, flight performance, species counts, distribution maps and recommendations.
Example outputs
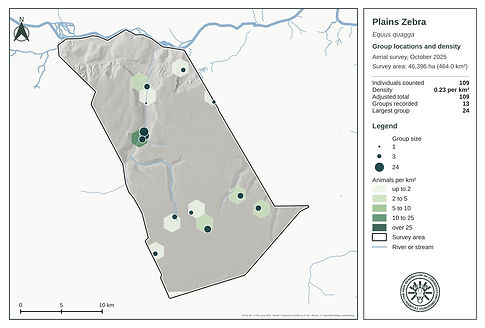
Maps from the anonymised sample survey. Every report includes a coverage map and a distribution map for each species.


Survey coverage: flight tracks and photographed area
Elephant: group locations and density

Buffalo: group locations and density
Plains zebra: group locations and density
FAQ
Common questions
Something else on your mind? Ask us directly.
We usually fly at least four hours a day, between about 7 and 11 am, when light and animal visibility are best. Timing varies with location and season. Depending on the survey design, we can cover 20,000 to 40,000 ha a day.
When do you fly, and how long does a survey take in the air?
Which species can you detect?
Wildlife over roughly 15 kg, across many types of ecosystems, from savannah to wetlands. Where there is tree cover, we have two ways to improve detection: our oblique (angled) imagery can see beneath some of the canopy, and we time surveys for the dry season, before the trees green up. Our camera setup is optimised for efficiency and detection, but no survey sees every animal. Our statistical models account for imperfect detectability, to improve population estimates.
How long until I receive results?
From survey design to results usually takes two to three months, depending on the size of the property, your budget and your objectives. A full manual count takes longer but gives the most accurate results.
What does a survey cost?
Every survey is priced to your area and goals. Request a quote and we'll recommend the right design.
Can I access my data later?
Yes. We keep your imagery and results secure with us, alongside the computing power and expertise to get the most out of them, and you can access them any time. Contact us for details.
Can my own team do the annotation?
Yes. We can train your staff to annotate imagery on our platform.
